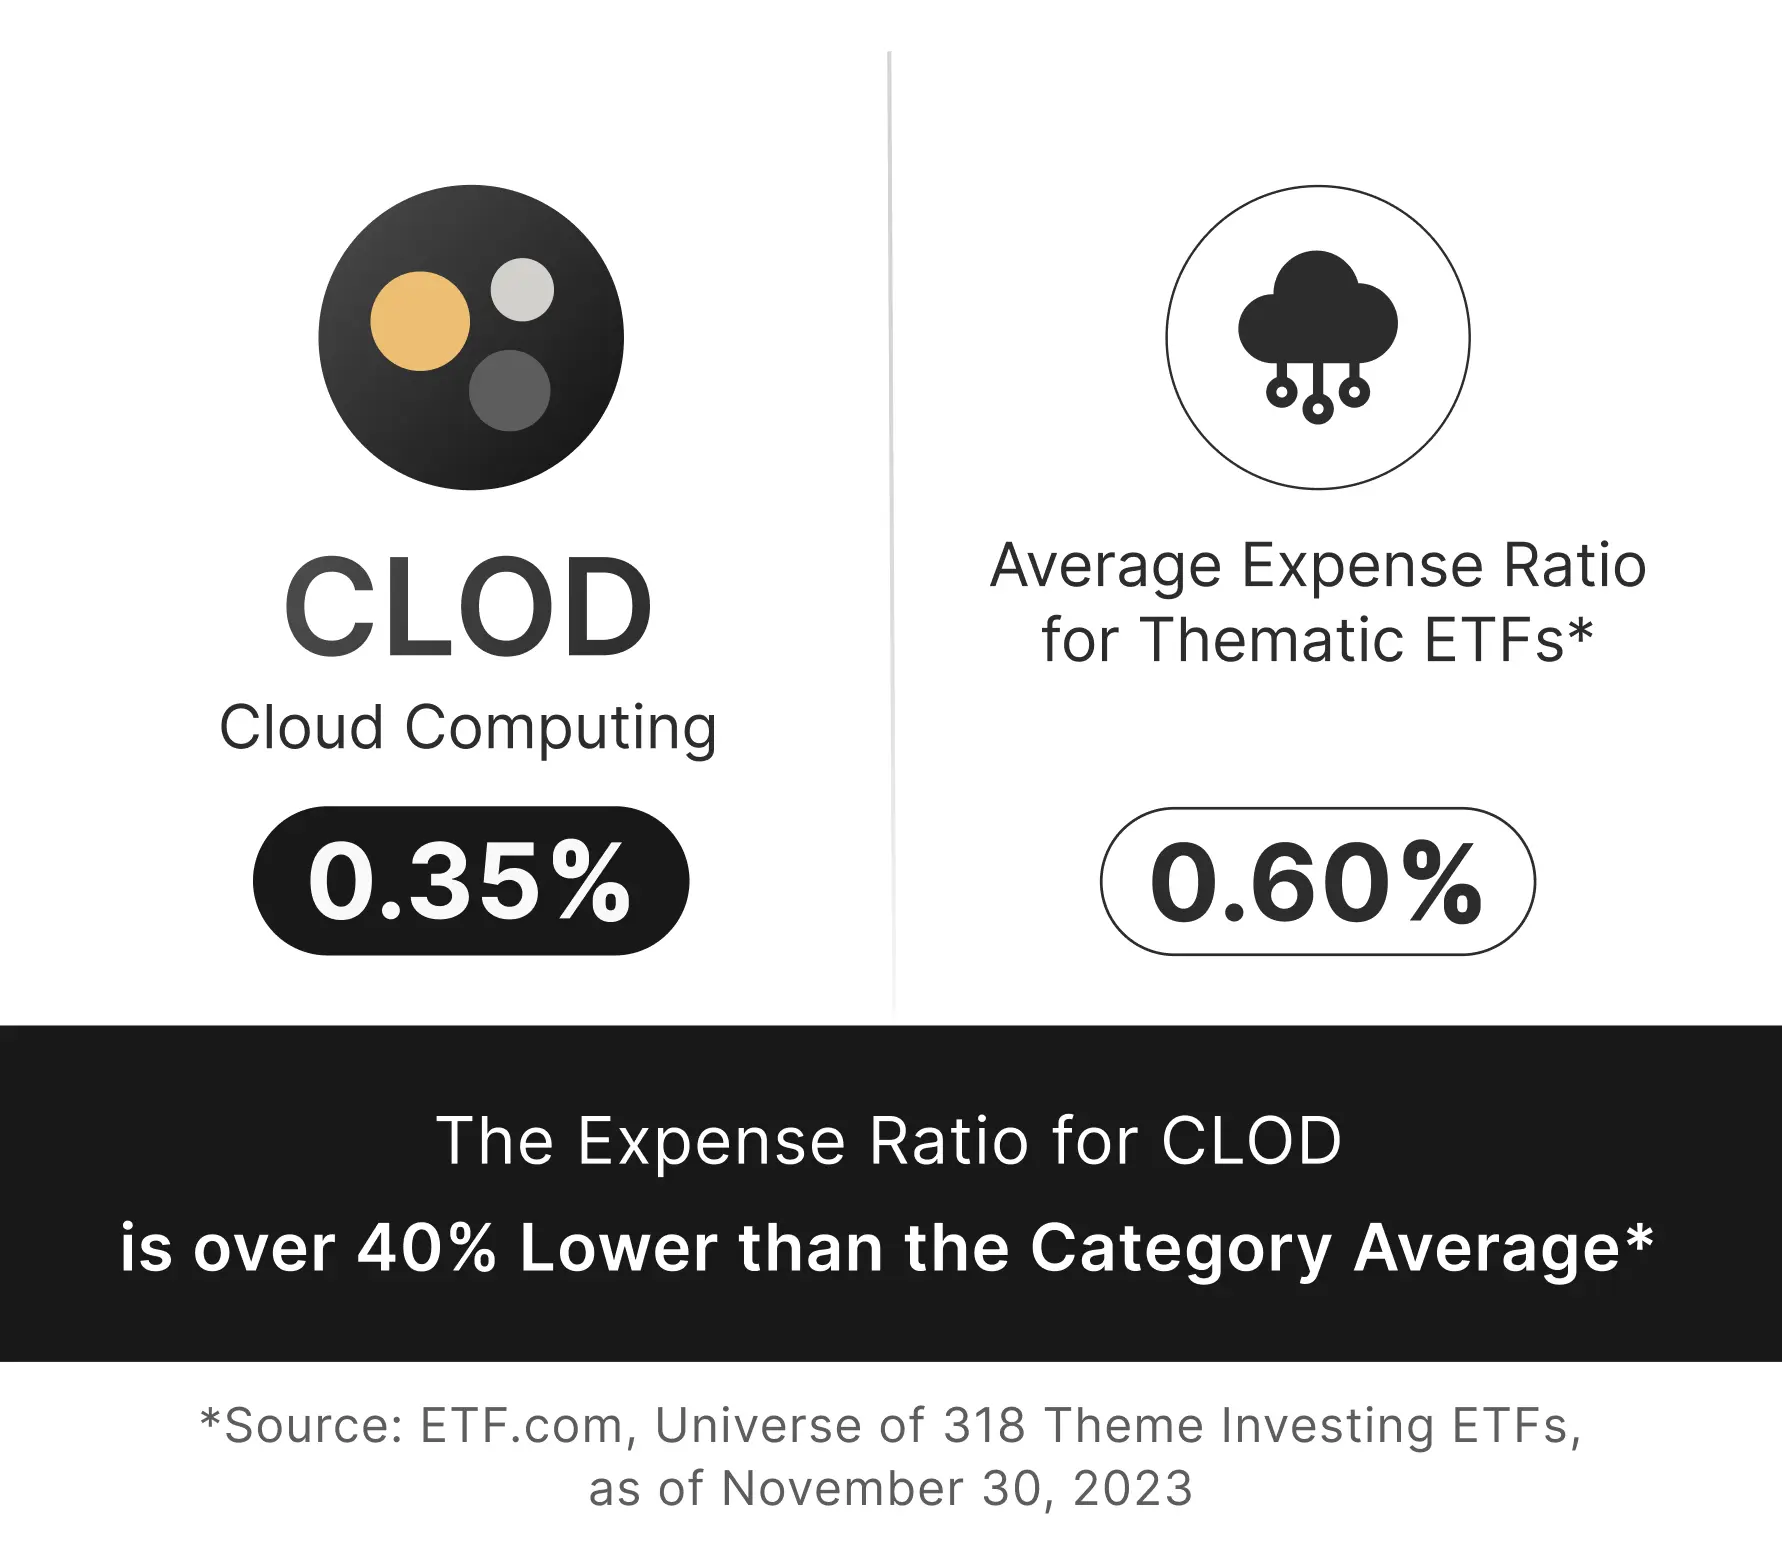

Shares of ETFs are bought and sold at market price (not NAV) and are not individually redeemed from the Fund. Brokerage commissions will reduce returns. The market price returns are based on the official closing price of an ETF share or, if the official closing price isn’t available, the midpoint between the national best bid and national best offer (NBBO) as of the time the ETF calculates current NAV per share, and do not represent the returns you would receive if you traded shares at other times. NAVs are calculated using prices as of 4:00 PM Eastern Time. Indices are unmanaged and do not include the effect of fees, expenses, or sales charges. One cannot invest directly in an index.
ALPS Distributors, Inc (1290 Broadway, Suite 1000, Denver, Colorado 80203) is the distributor for the Themes ETFs Trust.
Investing involves risk, including the possible loss of principal. The investable universe of companies in which CLOD may invest may be limited. The Fund invests in securities of companies engaged in Information Technology, which can be affected by rapid product obsolescence and intense industry competition. International investments may involve risk of capital loss from unfavorable fluctuation in currency values, from differences in generally accepted accounting principles or from social, economic or political instability in other nations. CLOD is non-diversified.
Shares of ETFs are bought and sold at market price (not NAV) and are not individually redeemed from the Fund. Brokerage commissions will reduce returns. The market price returns are based on the official closing price of an ETF share or, if the official closing price isn’t available, the midpoint between the national best bid and national best offer (“NBBO”) as of the time the ETF calculates current NAV per share, and do not represent the returns you would receive if you traded shares at other times. NAVs are calculated using prices as of 4:00 PM Eastern Time. Indices are unmanaged and do not include the effect of fees, expenses, or sales charges. One cannot invest directly in an index.
Carefully consider the funds’ investment objectives, risk factors, charges, and expenses before investing. This and additional information can be found in the funds’ summary or full prospectus, which may be obtained by calling 1-866-5Themes (1-866-584-3637) or by visiting themesetfs.com. Please read the prospectus carefully before investing.
Themes Management Company LLC serves as an adviser to the Themes ETFs Trust. The funds are distributed by ALPS Distributors, Inc (1290 Broadway, Suite 1000, Denver, Colorado 80203). Solactive, STOXX and BITA have been licensed by Solactive AG, ISS STOXX, and BITA Gmbh, respectively, for use by Themes Management Company LLC. Themes ETFs are not sponsored, endorsed, issued, sold, or promoted by these entities, nor do these entities make any representations regarding the advisability of investing in the Themes ETFs. Neither ALPS Distributors, Inc, Themes Management Company LLC nor Themes ETFs are affiliated with these entities.

Thank you for subscribing to our newsletter.
A confirmation letter has been sent to your email.
Check your inbox.
Thank you for subscribing to our newsletter. A confirmation letter has been sent to your email. Check your inbox.